Overview
Graphing Functions
When you open WCMGrapher, you will see two windows: the formatting window and the graph window. The appearance is slightly different on MacOS X systems (the examples in this users guide are drawn from WCMGrapher on a Windows system, but the MacOS X version is similar).
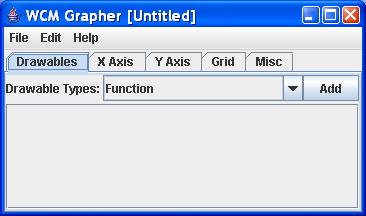
Figure 10 The Formatting Window

Figure 11 The Graph Window
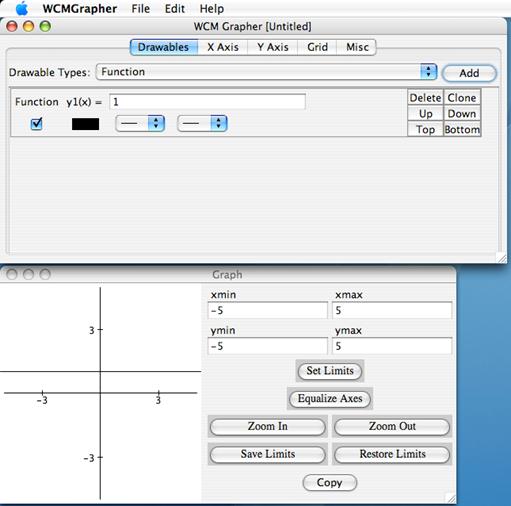
Figure 12 WCMGrapher windows on a MacOS X system
The formatting window is used for entering the functions to be graphed, formatting the curves, and setting up the axes. The formatting window also contains the menus for saving graphs, opening graph files, and copying the graph to the clipboard. The graph window shows the graph itself and has controls for adjusting the view of the graph.
The Drawables tab is used to create object that are drawn on the graph, such as curves of functions, parametric curves, text annotations, line segments, shapes, slope fields, etc. Since “Function” is shown in the “Drawable Types” menu, just click Add to add a function to the graph. You will see a horizontal line appear on the graph (a graph of the default function y = 1), and a function formatting panel will appear in the format window.
The check box at the left of the function panel indicates whether or not to show the graph. To graph a function, just click in the text box on the first line, backspace to delete the “1”, and type a function, such as “x^2”, then press ENTER. You should see a parabola on the graph window.

Figure 13 Entering a parabola
Function definitions are very similar to what you would enter in a modern graphing calculator. Expressions such as “sin(x+3)”, “(x+2)(x-2)/x^2”, etc. can be entered. If you type something in error, WCMGrapher will not display a graph for that function.
Copy The Graph
To copy your graph, either click the Copy button in the graph window, or select Copy Graph from the Edit menu. Now switch to another program, such as a word processing program, and paste. Your graph should appear in your program, like the graph shown below.

Formatting Your Graph
You can format your graph using the options in the functions panel. Click on the black box to open up a dialog that will enable you to choose a color for this function. The next two boxes on a function line let you set the thickness of the curve and whether it is solid or dashed. Click on the arrow to drop down a menu of choices. If you hover the cursor over one of the boxes, a “tool tip” will be displayed with a short description of what the control does.

Figure 14 Function Formatting
You can also control the formatting of the axes using the X Axis and Y Axis tabs. These tabs provide extensive control over the appearance of the axes.
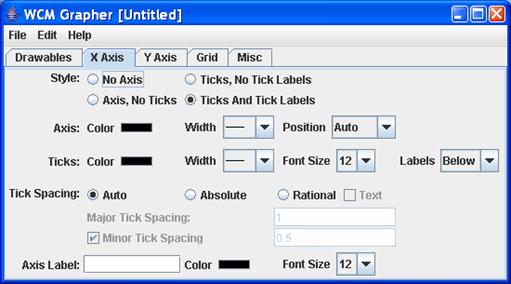
Figure 15 Axis Formatting
Resizing and Zooming
You can control what part of your function is displayed using the limit control panel on the right side of the graph window. You can zoom in, zoom out, or type specific minimum and maximum values for the x and y axes. You can also zoom into a specific part of your graph by click-dragging a rectangle on the graph window; the graph will be zoomed to show just the contents of the selected rectangle.

Figure 16 Limit Control Panel
When you copy the graph, it will be copied at the same size as shown on your screen. If you would like a bigger or smaller graph, or one that is more rectangular than square, just drag the lower right corner of the graph window to resize the whole window before you copy.
Saving Your Graph
You can save your graph using Save from the File menu. New, Open, Close, and Save As in the File menu all work as you would expect. WCMGrapher files end in .wgr, which is automatically added to the file name for you when you save a file.
Installation
You can obtain a copy of WCMGrapher from the Web
Components for Mathematics page at SourceForge.net
Once downloaded to your computer, double click it to run the installer. On all systems it will copy the WCMGrapher program and users guide to a directory you can specify (the installer will suggest one). On Windows and MacOS systems, the installer will also create file type associations (so that you can double click WCMGrapher graph files and open the program), and associate icons with the program and graph files. On Windows systems the installer will ask if you want to create Start Menu and desktop shortcuts.
The following screen shots show the installation screens for a Windows installation.

Figure 1 Installation introduction screen

Figure 2 License screen

Figure 3 Installation path screen

Figure 4 Installation pack selection screen
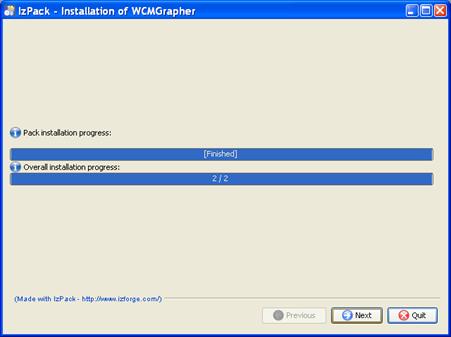
Figure 5 Installation progress screen

Figure 6 Shortcut option screen

Figure 7 Final install screen
MacOS Shortcuts

Figure 8 Adding WCMGrapher to the MacOS dock
System Requirements
WCMGrapher requires the Java Platform, Standard Edition version
5
For Mac OS X operating system users, you can download the latest version of Apple’s Java platform implementation by going to the Apple menu, selecting Software Update, and following the directions. If this shows the option to update the Java runtime environment, do so. If you aren’t sure whether you have version 5 or not, follow the instructions in the next paragraph; if you don’t have a JSRE 5.0 folder in step 5, then you do not have Java 5.
Macintosh computer users may also need to configure your Java settings to make J2SE 5 the default Java run time environment on your machine. To do this:

Figure 9 Macintosh OS X Java Preferences
Also for Mac OS X operating system users, check to see if copying a graph to a program works correctly. If the resulting graph is slanted, then you have Java platform version 5, but not the latest version. A bug in Apple’s Java platform causes this slant and was fixed in release 3 of Apple’s Java software. If you see this problem, perform a software update to get release 3 or later.
What’s New
2.2.0
This release focuses on improvements to the drawing of graphs.
Functions and other graphs: This release fixes a problem with how functions and other graphs computed their values. In previous releases a graph of a straight line, such as y1(x) = x, looked rather jagged in a random way. It now looks nice and straight. Also, the dashes in dashed curves didn’t always look very good; in this release dash appearance is improved (although still not perfect). Lastly, the antialiasing capabilities of the Java 2D graphic library had been used in some drawables but not others; this capability has been extended to all applicable drawables.
Vector Fields: You can now specify the spacing of the lines or arrows in a vector field via real number coordinate values, in addition to pixel-based spacing.
Printing: You can now print your graphs directly. There is also a page setup and a print preview option on the File menu.
Export: You can export your graph to a file in a variety of vector and bitmap graphics formats.
2.1.0
This release primarily improves the user interface and installation. It includes an installer for Windows, Linux, and MacOS X systems that puts the program and documentation in an appropriate place, enables application and graph file icons (on Windows and MacOS X systems), enables double clicking on graph file icons (on Windows and MacOS X systems), and creates shortcuts (on Windows systems).
For MacOS X systems, this release makes WCMGrapher look more “Mac-like.” It uses the native Macintosh look-and-feel, moves the menus to the top menu bar, and uses the appropriate Macintosh shortcut keys (i.e., the command key, instead of the control key used on Windows systems).
Axis Labels: In the previous version, WCMGrapher attempted to avoid overlapping tick labels in absolute and rational tick modes. Sometimes this was too aggressive, hiding labels that would actually have just fit. WCMGrapher no longer tries to avoid overlapping labels in absolute and rational tick modes; labels can overlap and it is up to the user to set the tick mark spacing appropriately.
Templates: You can now create template files that end with .wgt to save commonly used axis and grid settings.
Preferences: The preferences menu item now brings up a dialog that enables you set the default directory used by file chooser dialogs and to set a default template for new graphs.
Help: The WCMGrapher Help menu item in the Help menu now opens the users guide on Windows and Macintosh systems.
Axes and Grid Visibility: You can now control whether the axes and the grid appear behind other drawables (the default) or in front. This option is on the Misc. tab.
Default Font Size and Line Width: You can now specify the default font size and line width that are set when you add a new drawable to your graph. These options are on the Misc. tab.
Bug Fixes
· Setting a line drawable to use dashed style used to cause the line to become a segment. Now the line stays a line and uses dashed styling.
· The tick mark drawable used to show its label at the edge of the graph whenever the tick mark itself was off the screen. Now the label doesn’t show in this situation.
· If you deleted a drawable that was causing an error message to display on the graph, the drawable would be deleted but the error message used to get stuck on the graph, with no way to get rid of it other than closing down WCMGrapher and restarting. This is fixed; the error message now gets properly cleared.
· If you zoomed out too far when using absolute or rational ticks mode on an axis, WCMGrapher used to switch to automatic tick mode. Now, it stays in the mode you set, no matter how far out you zoom.
2.0.0
This release provides many new features. Note that 2.0.0 is not compatible with previous versions of WCMGrapher (i.e., it cannot open a .wgr file saved with a previous version). Future versions will be backward compatible with 2.0.0.
Drawables: Objects that can be graphed onto the graph window. Functions have become drawables (instead of having their own tab), but otherwise work the same as in previous versions. There are many other Drawable types, including lines, segments, rays, rectangles, ovals, text, parametric curves, vector fields, integral curves, custom tick marks, points, and Riemann sum rectangles.
Dynamic resize: When you resize the graph window, the graph is continuously redrawn while you drag. This makes it easier to get the correct size and shape for your graph.
Background color: You can now set the color of the graph’s background using the Misc. tab.
Border: You can turn on an optional border around the graph and set its color and line width.
Tool tips: The various fields and controls on WCMGrapher tabs and panels now will show a short help description if you hover the cursor over the control or field.
Undo/redo: WCMGrapher supports full undo and redo of virtually all edits, including multiple undo levels.
Cut/Copy/Paste: You can now do the standard cut, copy, and paste operations for text fields in WCMGrapher. You can do this between text fields in WCMGrapher and between WCMGrapher and other programs. Note that Ctrl-C has changed. It now invokes a text copy, instead of a graph copy (as in the previous version). To copy a graph, use the Copy Graph menu item or Ctrl-G.
Insert Symbol…: This feature allows you to insert special symbols, such as Greek letters or mathematical symbols, into text fields.
Bug Fixes:
· If you saved a file but did not type in the .wgr
extension, WCMGrapher would overwrite an old file of the same name with no
warning dialog. Now it does present a warning dialog.
1.1.0
This version adds the following:
Grid: You can show and format a background grid using the Grid tab.
Rational tick
labels: If your tick mark spacing is a rational multiple of π, you can
tell WCMGrapher to label the tick marks using rational multiples, instead of
the normal decimal version. For example, at π/2, normally WCMGrapher would
show 1.5179…. With rational mode, it will show either π/2 or ![]() (your choice).
(your choice).
1.0.0
This initial release provides support for graphing and formatting functions, basic formatting of the axes, saving and opening graph files, and copying the graph to the system clipboard (for pasting into other applications).

License and Source Code
WCMGrapher is built using the Web Components for Mathematics software library. WCM was originally developed by David Ecks as the Java Components for Mathematics (see http://math.hws.edu/javamath/ ). The WCMGrapher source code and the source code for WCM are both available at SourceForge.net from the WCM download pages (see http://sourceforge.net/projects/webcompmath ).
Use of WCMGrapher is provided free of charge subject to the following license (the MIT open source license):
ã2007 Thomas S. Downey
Permission is hereby granted, free of charge, to any person obtaining a copy of this software and associated documentation files (the "Software"), to deal in the Software without restriction, including without limitation the rights to use, copy, modify, merge, publish, distribute, sublicense, and/or sell copies of the Software, and to permit persons to whom the Software is furnished to do so, subject to the following conditions:
The above copyright notice and this permission notice shall be included in all copies or substantial portions of the Software.
THE SOFTWARE IS PROVIDED "AS IS", WITHOUT WARRANTY OF ANY KIND, EXPRESS OR IMPLIED, INCLUDING BUT NOT LIMITED TO THE WARRANTIES OF MERCHANTABILITY, FITNESS FOR A PARTICULAR PURPOSE AND NONINFRINGEMENT. IN NO EVENT SHALL THE AUTHORS OR COPYRIGHT HOLDERS BE LIABLE FOR ANY CLAIM, DAMAGES OR OTHER LIABILITY, WHETHER IN AN ACTION OF CONTRACT, TORT OR OTHERWISE, ARISING FROM, OUT OF OR IN CONNECTION WITH THE SOFTWARE OR THE USE OR OTHER DEALINGS IN THE SOFTWARE.